Kubernetes OOMKilled: diagnose before raising memory
A restart is evidence to investigate. Increasing a limit without understanding the workload can hide the problem or move it elsewhere.
Quick answer
When a Kubernetes container reports OOMKilled, preserve its termination details and examine memory use against its configured limit. Check node conditions separately so you do not confuse a container kill with Pod eviction. Reproduce the failing work, identify the memory driver, and validate any limit or application change under representative load.
On this page
For a Kubernetes OOMKilled container, inspect the terminated container’s status and effective memory settings before raising its limit. Separate a container out-of-memory termination from node-pressure eviction or a Pod that never scheduled. Then reproduce the workload condition that exhausted memory. The reason tells you what happened, not whether the application has a leak. [1][2][3]
What evidence should you collect before the next restart?#
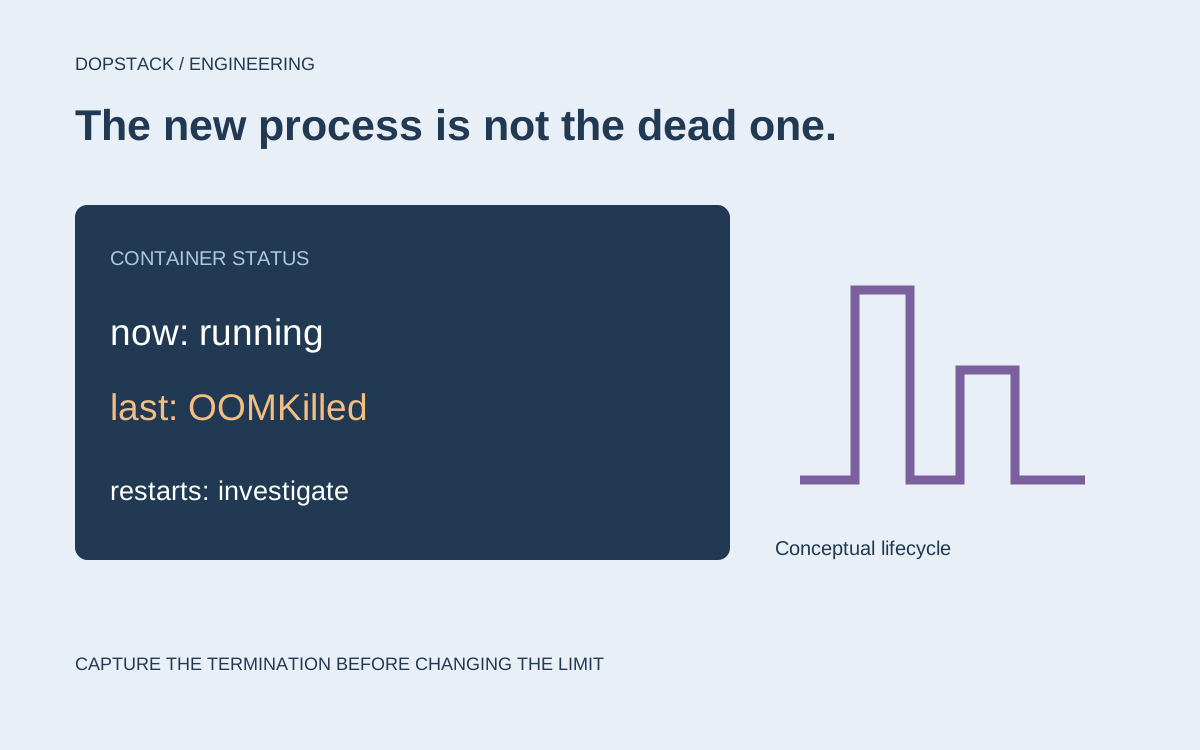
An illustrative worker starts, consumes a large batch and restarts before an operator opens its dashboard. A moment later its current memory looks ordinary. The new process is small because it has just started; that observation does not describe the process that died. Begin with the container’s last termination and the workload configuration that applied to it.
# Replace namespace and pod with the affected workload.
kubectl get pod example-worker -n example-team -o yaml
kubectl describe pod example-worker -n example-team
# Inspect every relevant container, not just the Pod phase.
These read-only commands show current API evidence; they are not a load test and have not been run against your cluster. The memory tutorial uses the Pod YAML to inspect lastState.terminated. In a multi-container Pod, identify the affected container by name and distinguish its previous termination from its current state. Capture the record before replacement or later restarts make it harder to connect to the original failure. [1][2]
# Selected illustrative fields, not a complete Pod manifest.
containerStatuses:
  - name: worker
    restartCount: 4
    state:
      running: {}
    lastState:
      terminated:
        reason: OOMKilled
        exitCode: 137
Here the container is running now and its previous instance was terminated. The named reason is more useful than an exit code alone: a process can be killed for reasons that an isolated numeric code cannot explain. Record the timestamp, node, image version and input condition alongside this status. You need that join to compare the failure with memory telemetry or application logs.
Conceptual illustration
Three different memory investigations
Container terminated
Inspect lastState and allocation peak
Pod evicted
Inspect node pressure and eviction evidence
Pod never placed
Inspect scheduling requests and events
Container restarted
Current usage describes a new process
What exactly restarted or disappeared?#
Start at the affected Pod and container. Record the terminated container’s reason, the relevant timestamps, restart history and the node that hosted it. Then inspect the Pod’s events and whether a controller created a replacement Pod. Our rule is to establish object identity before comparing symptoms: a replacement Pod and a restarted container are not the same event.
The Kubernetes memory task demonstrates a container exceeding its configured limit and reporting OOMKilled. The resource-management documentation explains that memory enforcement is reactive. It is not the same mechanism as CPU throttling, so treating memory exhaustion as a temporary slowdown can obscure why the process disappeared. [1][2]
| Evidence | Boundary to investigate | Do not infer |
|---|---|---|
| Container termination says OOMKilled | Container and node memory context | A memory leak from that reason alone |
| Pod is evicted with node-pressure evidence | Node resource availability and eviction policy | That raising this container limit is the fix |
| Pod remains unscheduled | Requests and placement constraints | That an application process already ran out of memory |
| Working set rises during one operation | Application allocation pattern | That idle usage represents the peak |
Are requests and limits being confused?#
Requests influence scheduling; memory limits constrain the container’s allowed consumption. Kubernetes documents these separately. Inspect the effective configuration that reached the cluster, including any admission defaults, rather than assuming that the manifest in a source branch is the running configuration. [1][2]
Record startup behavior, ordinary working set and peak operations separately. Ask which concurrency, payload size, batch size or cache population was active at failure. A resource change should name the workload condition it is intended to support. Otherwise the team has no way to decide whether the new value is adequate or merely postpones the next failure.
Why can idle usage hide a predictable failure?#
Suppose the worker reads an entire export into memory before transforming it. Its idle footprint is small, but its peak depends on input size and concurrent work. Increasing the limit may accommodate the intended workload; it may also postpone the next failure if the input can grow without a bound. You need to choose which behavior the product promises before selecting another number.
Separate three hypotheses. A bounded operation may need more legitimate working memory. An avoidable copy may multiply an otherwise reasonable input. Unexpected retention may keep memory after work completes. All three can produce a rising graph, but they call for capacity planning, a buffering change or retention investigation respectively. Treat the graph as evidence of a trajectory, not a diagnosis by itself.
| Hold fixed | Vary deliberately | Question answered |
|---|---|---|
| Image and configuration | Input size | Does peak use scale with the operation? |
| Input size | Worker concurrency | Are simultaneous allocations the cause? |
| Input and concurrency | Repeated completed batches | Does retained usage settle or accumulate? |
| Workload shape | One implementation change | Did the proposed repair change the cause? |
Use a controlled environment and representative, non-sensitive fixtures. Capture peaks with the available runtime and container instrumentation; the collection interval matters when allocations are short-lived. State the measurement method with the result. A sparse chart that missed the peak cannot establish how much headroom existed, and a successful tiny fixture cannot establish the production input boundary.
Changing a memory request and changing a limit answer different questions. The request participates in scheduling; the limit constrains allowed consumption. Review the effective Pod, because defaults or admission changes may differ from the manifest in Git. A higher limit can let the process consume more, but it does not reserve that additional capacity merely by being present. [1][2]
Is the node under pressure?#
Node-pressure eviction is an explicit kubelet mechanism with soft and hard thresholds. Hard thresholds have no grace period. Investigate node conditions, other workloads and the applicable eviction policy rather than treating every disappearance as proof of a bad application-level memory limit. [3]
Compare affected and unaffected replicas against node placement and timing. If failures cluster on a node or coincide with another workload, retain that correlation as a hypothesis. Do not turn it into a root-cause statement without checking what consumed memory and which mechanism selected the victim. A higher limit may change scheduling capacity and shared-node risk, so review it with the platform owner.
How should you test the proposed fix?#
- Capture a reproducible operationUse a controlled environment and representative input. Record concurrency, relevant settings and the observed memory trajectory without exposing production payloads.
- Change one cause at a timeSeparate an application allocation change from a resource-limit change. Keep the comparison understandable and retain the configuration for each attempt.
- Exercise the lifecycleCheck startup, warm operation, repeated work and recovery after a failure. A single successful request is weak evidence for a sustained workload.
- Define the acceptance resultRequire completion of the representative work with understood headroom and no new node-pressure problem. Document which workload sizes remain unsupported.
Ask whether memory is temporary, retained intentionally, or retained unexpectedly. A large batch, duplicate buffering and an unbounded cache need different remedies. Use the runtime’s appropriate profiling tools in a suitable environment and compare allocation evidence with the failing operation. Do not label a leak solely because a graph rose once.
Leave a workload limit the next engineer can explain#
Write an acceptance statement with the supported workload: input shape, concurrency, warm-up behavior and relevant resource settings. Then exercise repeated work and recovery, not just process startup. If an incident mitigation raised a limit temporarily, record who owns the follow-up and what evidence will determine whether to keep it.
The final decision may be a legitimate capacity increase. It may instead be streaming a bounded portion of the input, reducing simultaneous work or fixing unintended retention. Choose the remedy that explains the observed failure and the supported workload. “It stopped restarting for a few minutes” is a recovery observation; it is not yet an explanation.
Kubernetes memory questions#
- Does OOMKilled prove the application has a leak?
- No. It establishes an out-of-memory termination to investigate, not the allocation cause. Examine the operation, workload size, concurrency and memory history before distinguishing an intentional peak from unexpectedly retained memory. [1][2]
- Should I increase the request or the limit?
- Determine the failed boundary first. Requests affect scheduling, while limits constrain consumption. A workload that cannot be placed needs a different investigation from one that runs and is then terminated for memory exhaustion. [1][2]
- Is an evicted Pod the same as an OOMKilled container?
- Do not treat them as interchangeable. Inspect termination details, Pod events and node conditions. Kubernetes documents node-pressure eviction as its own mechanism, so use the observed reason to choose the investigation. [3]
- What makes the fix ready for production?
- Our acceptance condition is a repeatable test of the formerly failing work, an understood resource requirement, and no newly introduced shared-node problem. Record the tested input and limits instead of claiming a universal memory setting.